Solar Panel Output in Irish Weather: Real Numbers for Every County
Irish weather is not the solar killer many assume. This guide gives you county-level irradiance data, seasonal output tables, and the real factors that determine your annual solar panel output — from roof angle to shading to panel quality.
By Smart Solar Editorial · Updated 15 May 2026 · 8 min read
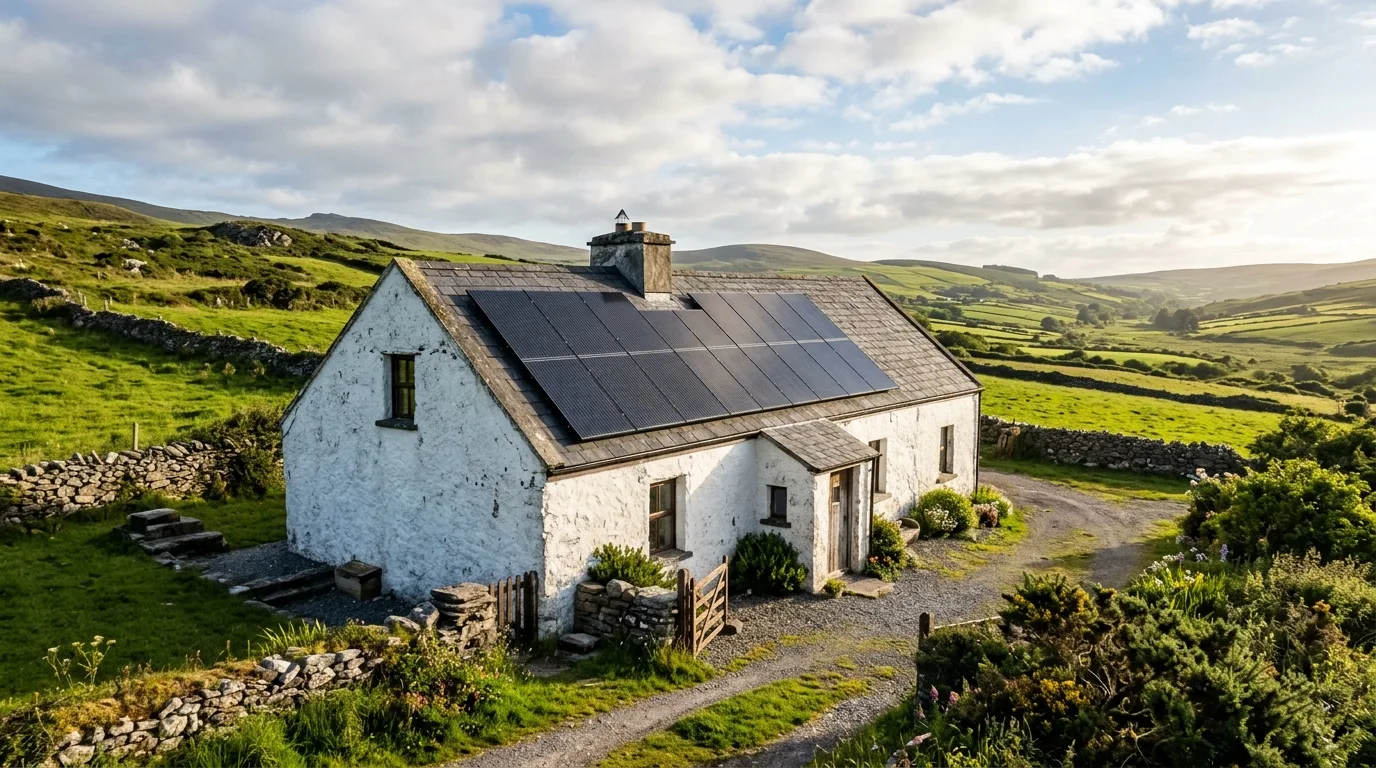
Solar panel output in Ireland is frequently underestimated. The country's reputation for rain and cloud has led many homeowners to dismiss solar PV before investigating the numbers. But measured solar irradiance data from SEAI and the European Commission's PVGIS tool tells a more encouraging story — one that explains why over 100,000 Irish households have installed solar PV systems.
Ireland's Solar Resource by County
Ireland receives between 900 and 1,150 kWh of global horizontal irradiance (GHI) per square metre per year. This is the total solar energy hitting a flat surface, and it's the baseline from which your system's tilted, south-facing output is calculated.
| Region | Counties | Annual GHI (kWh/m²) | Est. kWh per kWp (south, 35° tilt) |
|---|---|---|---|
| South | Cork, Waterford, Wexford | 1,050–1,150 | 950–1,050 |
| Southeast | Kilkenny, Carlow, Wicklow | 1,000–1,100 | 900–990 |
| East | Dublin, Kildare, Meath, Louth | 980–1,060 | 880–960 |
| Midlands | Laois, Offaly, Westmeath, Longford | 950–1,040 | 860–940 |
| West | Galway, Clare, Limerick | 950–1,050 | 860–950 |
| Southwest | Kerry | 980–1,080 | 880–970 |
| Midlands/North | Tipperary, Roscommon, Sligo | 930–1,020 | 840–920 |
| Northwest | Donegal, Leitrim, Cavan | 900–980 | 820–880 |
| North | Monaghan, Armagh border | 900–960 | 820–865 |
The specific yield (kWh per kWp per year) for an optimally oriented south-facing roof at 30–40° tilt ranges from roughly 820–1,050 kWh/kWp/yr across Ireland, with a national median around 900–950 kWh/kWp/yr.
For a 4 kWp system, this translates to 3,280–4,200 kWh per year depending on location.
Monthly and Seasonal Output Profile
Output in Ireland is highly seasonal. Understanding this pattern helps you plan self-consumption strategy, battery sizing, and expectations for winter bills.
Approximate monthly output for a 4 kWp south-facing 35° tilt system in Dublin:
| Month | Est. Output (kWh) | Avg. Daily (kWh) |
|---|---|---|
| January | 120–160 | 4–5 |
| February | 170–220 | 6–8 |
| March | 310–380 | 10–12 |
| April | 420–510 | 14–17 |
| May | 550–650 | 18–21 |
| June | 590–700 | 20–23 |
| July | 560–670 | 18–22 |
| August | 500–610 | 16–20 |
| September | 340–420 | 11–14 |
| October | 210–280 | 7–9 |
| November | 130–170 | 4–6 |
| December | 100–140 | 3–5 |
| Annual Total | 4,000–4,910 | 11–13 avg |
Summer months (May–August) account for roughly 55–60% of annual output. Winter months (November–February) contribute only 15–18%. This seasonal imbalance is why battery storage alone cannot solve the winter energy problem — batteries sized for summer surpluses can't store enough for the winter shortfall. See our analysis of solar and battery storage economics.
What Affects Your Actual Solar Panel Output in Ireland?
1. Roof Orientation (Azimuth)
The direction your roof faces has the biggest impact on annual yield. Using 100% as the baseline for a perfect south-facing roof:
| Orientation | Output Relative to South |
|---|---|
| South (180°) | 100% |
| South-Southeast / South-Southwest | 97–99% |
| Southeast / Southwest | 90–95% |
| East / West | 78–85% |
| Northeast / Northwest | 62–72% |
| North-facing | Not recommended (below 55%) |
An east-west split array (panels on both east and west slopes) is a good solution for ridged roofs with no south face. While individual panels produce less, the array generates a flatter production curve across the day rather than a sharp midday peak — which often improves self-consumption.
2. Roof Tilt Angle
The optimal tilt for Ireland is approximately 30–40° from horizontal. Most Irish pitched roofs fall in the 25–45° range, which is near-optimal. Flat roofs can use ballasted tilt frames, typically set at 10–15° for wind load reasons (lower profile) while sacrificing some annual output.
3. Shading
Even partial shading causes disproportionate output losses with standard string inverter systems. A single shaded panel in a string can reduce the entire string's output to match the shaded panel's level. Key shading sources on Irish roofs:
- Chimneys (particularly on terraced or semi-detached houses)
- Neighbouring roof ridges (prevalent in densely built Dublin suburbs)
- Dormers
- Satellite dishes and aerials
- Nearby trees (including deciduous ones that lose leaves in winter)
A shading loss of 10–20% is not unusual on constrained Dublin suburban roofs. Power optimisers or microinverters eliminate most string-level shading losses. Read our power optimisers guide for detail.
4. Panel Temperature
Solar panels lose approximately 0.35–0.45% of output for every degree above 25°C. Ireland's mild climate is an advantage here. While a panel in Spain might reach 70°C on a clear day (losing 20% of rated output), an Irish panel on a warm July day typically reaches 45–55°C, losing only 7–13%. On cool, bright spring days when panels might be 15–20°C, they can actually exceed their rated output because the temperature coefficient works in reverse below 25°C.
5. Soiling and Dust
Ireland's frequent rainfall is an unlikely benefit — it keeps panels naturally clean. Dust accumulation (the main soiling issue in dryer climates) is minimal. Annual cleaning is generally not required in most of Ireland, unlike in southern Europe. Bird droppings near nesting sites can cause localised shading and should be removed. See our solar panel maintenance guide.
6. System Losses
No PV system converts 100% of the solar energy hitting the panels into usable electricity. Typical system losses include:
| Loss Type | Typical Magnitude |
|---|---|
| Inverter efficiency | 3–5% |
| DC cable losses | 1–2% |
| AC cable losses | 0.5–1% |
| Soiling (Ireland) | 1–3% |
| Mismatch between panels | 0.5–2% |
| Shading (open rooftop) | 0–5% |
| Total system losses | ~15–20% |
This is why a 4 kWp panel array doesn't produce 4 × peak sun hours × 365 days of electricity. Industry standard modelling uses a performance ratio (PR) of 0.75–0.85 for Irish residential systems, meaning 75–85% of theoretical maximum output is delivered to your meter.
Tools to Model Your Own Output
Before committing to a system size and investment, it's worth modelling expected output using:
- PVGIS (EU JRC): Free tool at re.jrc.ec.europa.eu. Enter your address, panel area, and orientation to get monthly and annual output estimates calibrated to meteorological data.
- SEAI Energy Modelling: SEAI's BER assessment process includes solar PV modelling for grant applications.
- Installer-provided simulations: Any credible SEAI-registered installer should provide a site-specific output projection using software like PVsyst or PVSOL. Insist on this before signing a contract.
Real-World vs Modelled Output
Real-world monitoring data from Irish residential PV systems consistently shows output within 5–10% of well-modelled projections. Larger deviations usually indicate:
- An optimistic quote that overstated output
- Unmodelled shading
- A faulty inverter or panel degradation issue
After your system is installed, your inverter's monitoring app (SolarEdge monitoring, Fronius Solar.web, or Enphase Enlighten) will show daily, monthly, and annual output. Most homeowners find the actual figures meet or exceed installer projections when the system was correctly specified.
Summary
Solar panel output in Ireland averages 850–1,050 kWh per kWp per year for a well-oriented south-facing system, with southern counties outperforming northern ones. A 4 kWp system in Dublin generates roughly 3,600–4,200 kWh/year; in Cork or Wexford, the same system might produce 4,000–4,600 kWh. The key variables are orientation, tilt, shading, and system design — all things a competent installer will account for in their proposal.
Want to understand what these numbers mean for your electricity bills? See our solar panel payback period guide for a worked financial example.
Get 3 free solar quotes — free and no obligation.
Frequently asked questions
How many kWh per kWp can I expect from solar panels in Ireland?
For a south-facing roof at a 30–40° tilt, expect 850–1,050 kWh per kWp per year depending on your county. Southern counties (Cork, Wexford, Waterford) are at the higher end. Dublin and Leinster average 880–960 kWh/kWp. Western counties (Galway, Mayo) average 860–950 kWh/kWp.
What is the best roof orientation for solar panels in Ireland?
South-facing at 30–40° tilt is optimal, producing maximum annual output. Southeast and southwest orientations lose only 5–10% of annual output. East and west orientations lose 15–22% but can still be financially viable. North-facing roofs are not recommended for solar PV.
Do solar panels produce much electricity in Irish winters?
Irish winters see significantly reduced solar output. A 4 kWp system might produce only 100–160 kWh in December (vs 590–700 kWh in June). However, winter production still offsets some daytime electricity use and is part of the annual financial calculation. A battery helps maximise winter daytime production but cannot compensate for the overall low irradiance.
Which Irish county gets the most solar energy?
Cork, Wexford, and Waterford consistently receive the highest annual solar irradiance in Ireland — typically 1,050–1,150 kWh/m² per year. Donegal and Leitrim in the northwest receive the least — around 900–980 kWh/m². The difference translates to roughly 10–15% more annual output in the south versus the northwest.
Does rain clean solar panels in Ireland?
Yes. Ireland's frequent rainfall naturally rinses dust and light soiling from panels, meaning solar panel cleaning is rarely required. Heavy bird droppings near nesting sites are the main exception — these should be manually cleaned as they can cause shading and localised hot spots.
Sources & further reading
- PVGIS Solar Radiation Database — Ireland — European Commission Joint Research Centre
- SEAI Solar Energy Mapping — Sustainable Energy Authority of Ireland
- Met Éireann Solar Radiation Data — Met Éireann